Tag Viewer
Use the Tag Viewer to learn the status of all of your project tags. This can provide information that you need to troubleshoot the project.
You can filter the tags that you view by individual equipment included in the project. You can also filter on strings that are part of the tag description or tag name. The tag viewer will work in all supported screen resolutions.
To view tags:
Click the tab for the page that was used when setting up the tag viewer, then select Tag Viewer. The viewer displays in a screen similar to this:
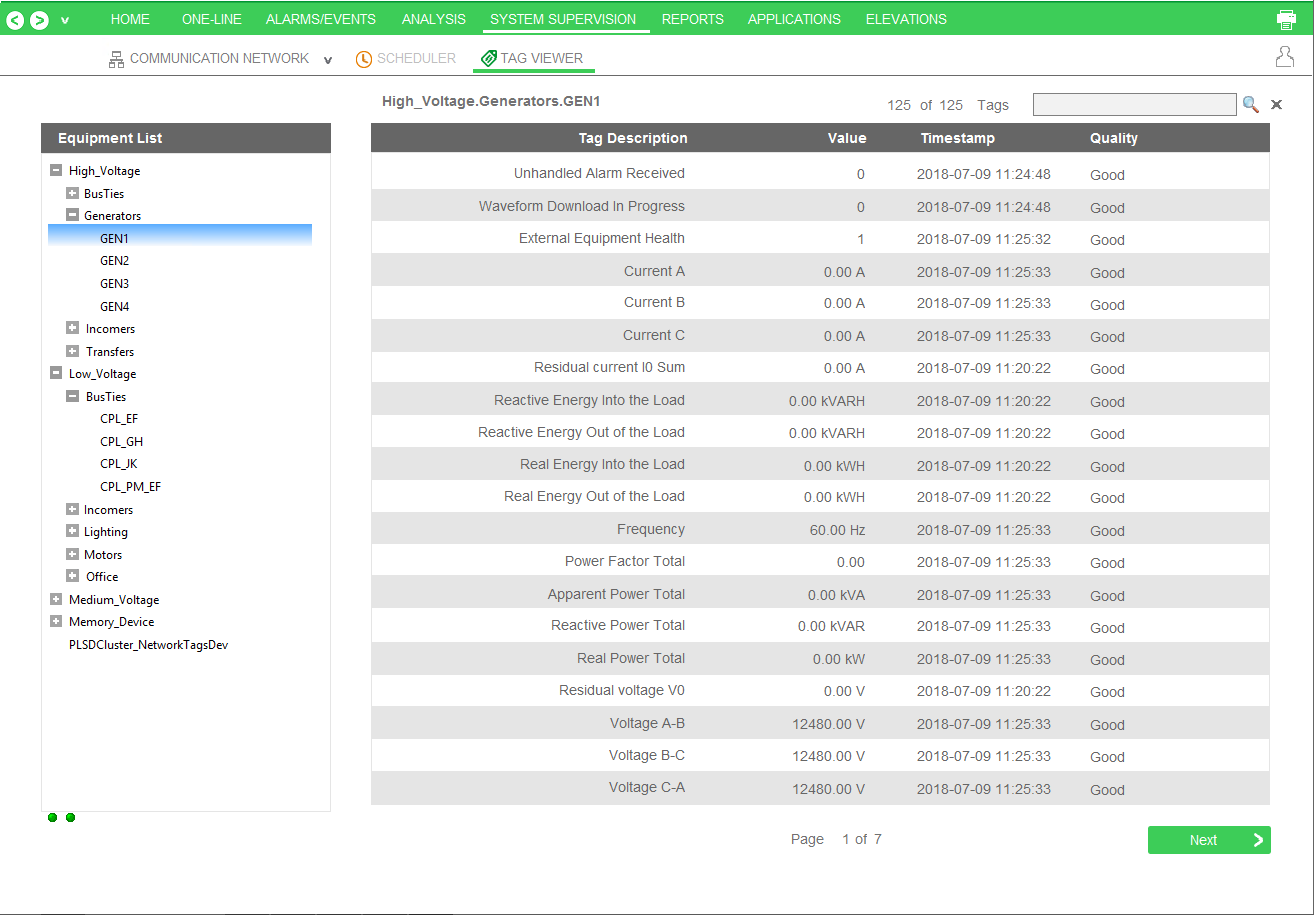
Note the following features:
Filter by equipment: The left-hand pane gives you the option to filter by equipment name. Most equipment is grouped by voltage level. You can select one equipment node, and you will view the tags for that equipment.
Filter by tag: In the upper right corner of the screen, type the tag name. You can type a string, such as "power factor," and you will retrieve a list of tags that have "power factor" in their tag description or tag name.
NOTE: Any time you display a tag, you add to the dynamic point count. See "Dynamic-point Count Licensing" in the Plant SCADA help file (default location: Program Files > Schneider Electric > Power Operation > v2024 > bin) for more information about point counts.
The viewer includes the following columns:
- Tag Description/Tag Name: the description and name used when the equipment was added to Power Operation.
- Value/Timestamp: The real-time value that was read at the date/time shown.
- Quality: The data quality (for example, Good or Bad) of the tag from Power Operation Studio.
Use Previous and Next to scroll through multiple pages.